Henk Shang Request demo CV (PDF)
Portrait of Henk Shang

Advanced light microscopy · Quantitative 3D imaging

Henk (Wenhao) Shang, Ph.D.

Microscopist and image-analysis scientist

I design imaging experiments end to end: tissue clearing and whole-mount staining, confocal, light-sheet and in vivo multiphoton acquisition, and the quantitative analysis that turns volumes into numbers. At UCSF I run my lab's two- and three-photon microscopes as a shared resource, image samples for collaborating labs and train the people who use the instruments.

10 yearshands-on optical microscopy, from building a Raman optical tweezers system to in vivo multiphoton
1,000+microscopy images acquired and analyzed: retinal vasculature, retinal ganglion cells, blood flow
99 volumestwo-photon benchmark dataset with expert vessel graphs and six-way layer labels
4 labsoutside my own trained on the 3D analysis pipeline I built
See the imaging Instruments & training
Live 3D: mouse retinal vasculature imaged in vivo by two-photon microscopy, traced and split into its three plexuses (534 × 534 × 322 µm). Drag to rotate, scroll to zoom, double-click to resume spinning; click a layer to hide it.

Imaging portfolio

From a living eye to a cleared whole organ

Volumes from my imaging projects. The parameter cards are read from each file's instrument metadata. Use the tabs to switch between views; click an image to enlarge it.

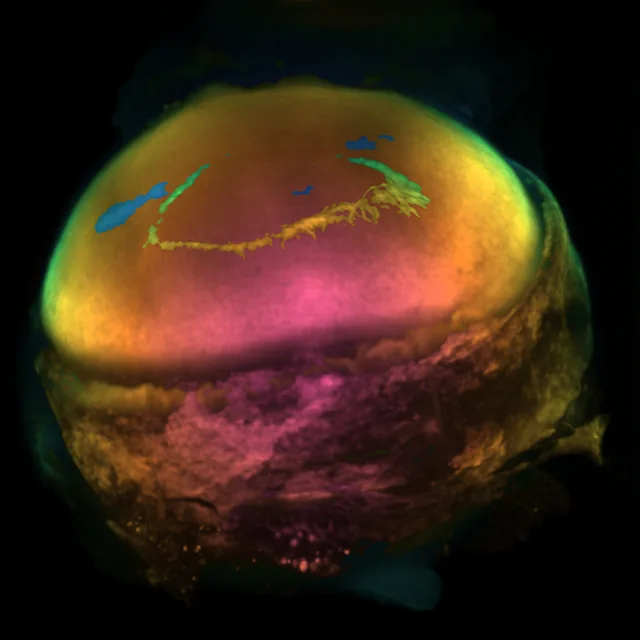
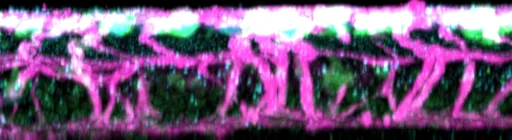
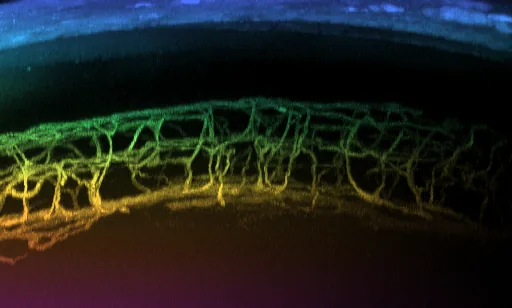
Side projection of in vivo two-photon retinal vasculature showing three plexuses Wide-field two-photon projection of the retina, colour-coded by depth Rotating projection of the three vascular plexuses
In vivo two-photon

Retinal vasculature through the intact eye

Trans-scleral two-photon imaging resolves all three vascular plexuses of the mouse retina, and the vertical vessels that connect them, in one volume. Side and wide-field views are colour-coded by depth; the 3D view shows the plexuses after segmentation.

Sample
Mouse retina, in vivo, trans-scleral
Volume
512 × 512 × 161 voxels · 534 × 534 × 322 µm
Voxel
1.04 × 1.04 × 2.0 µm
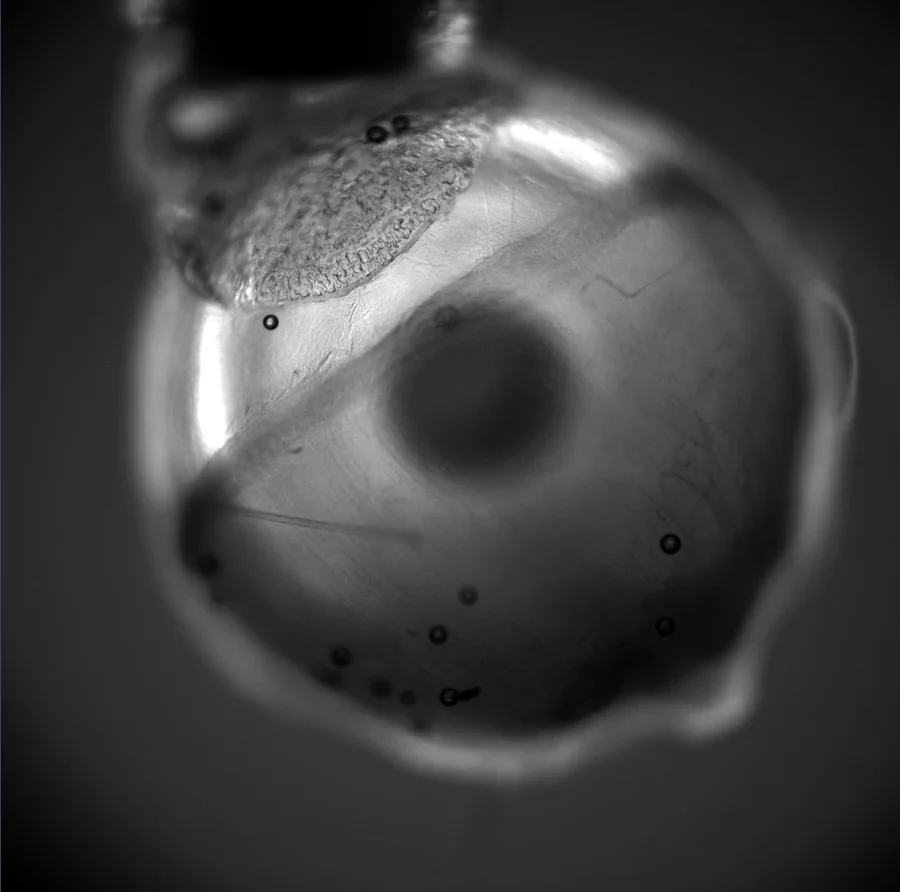
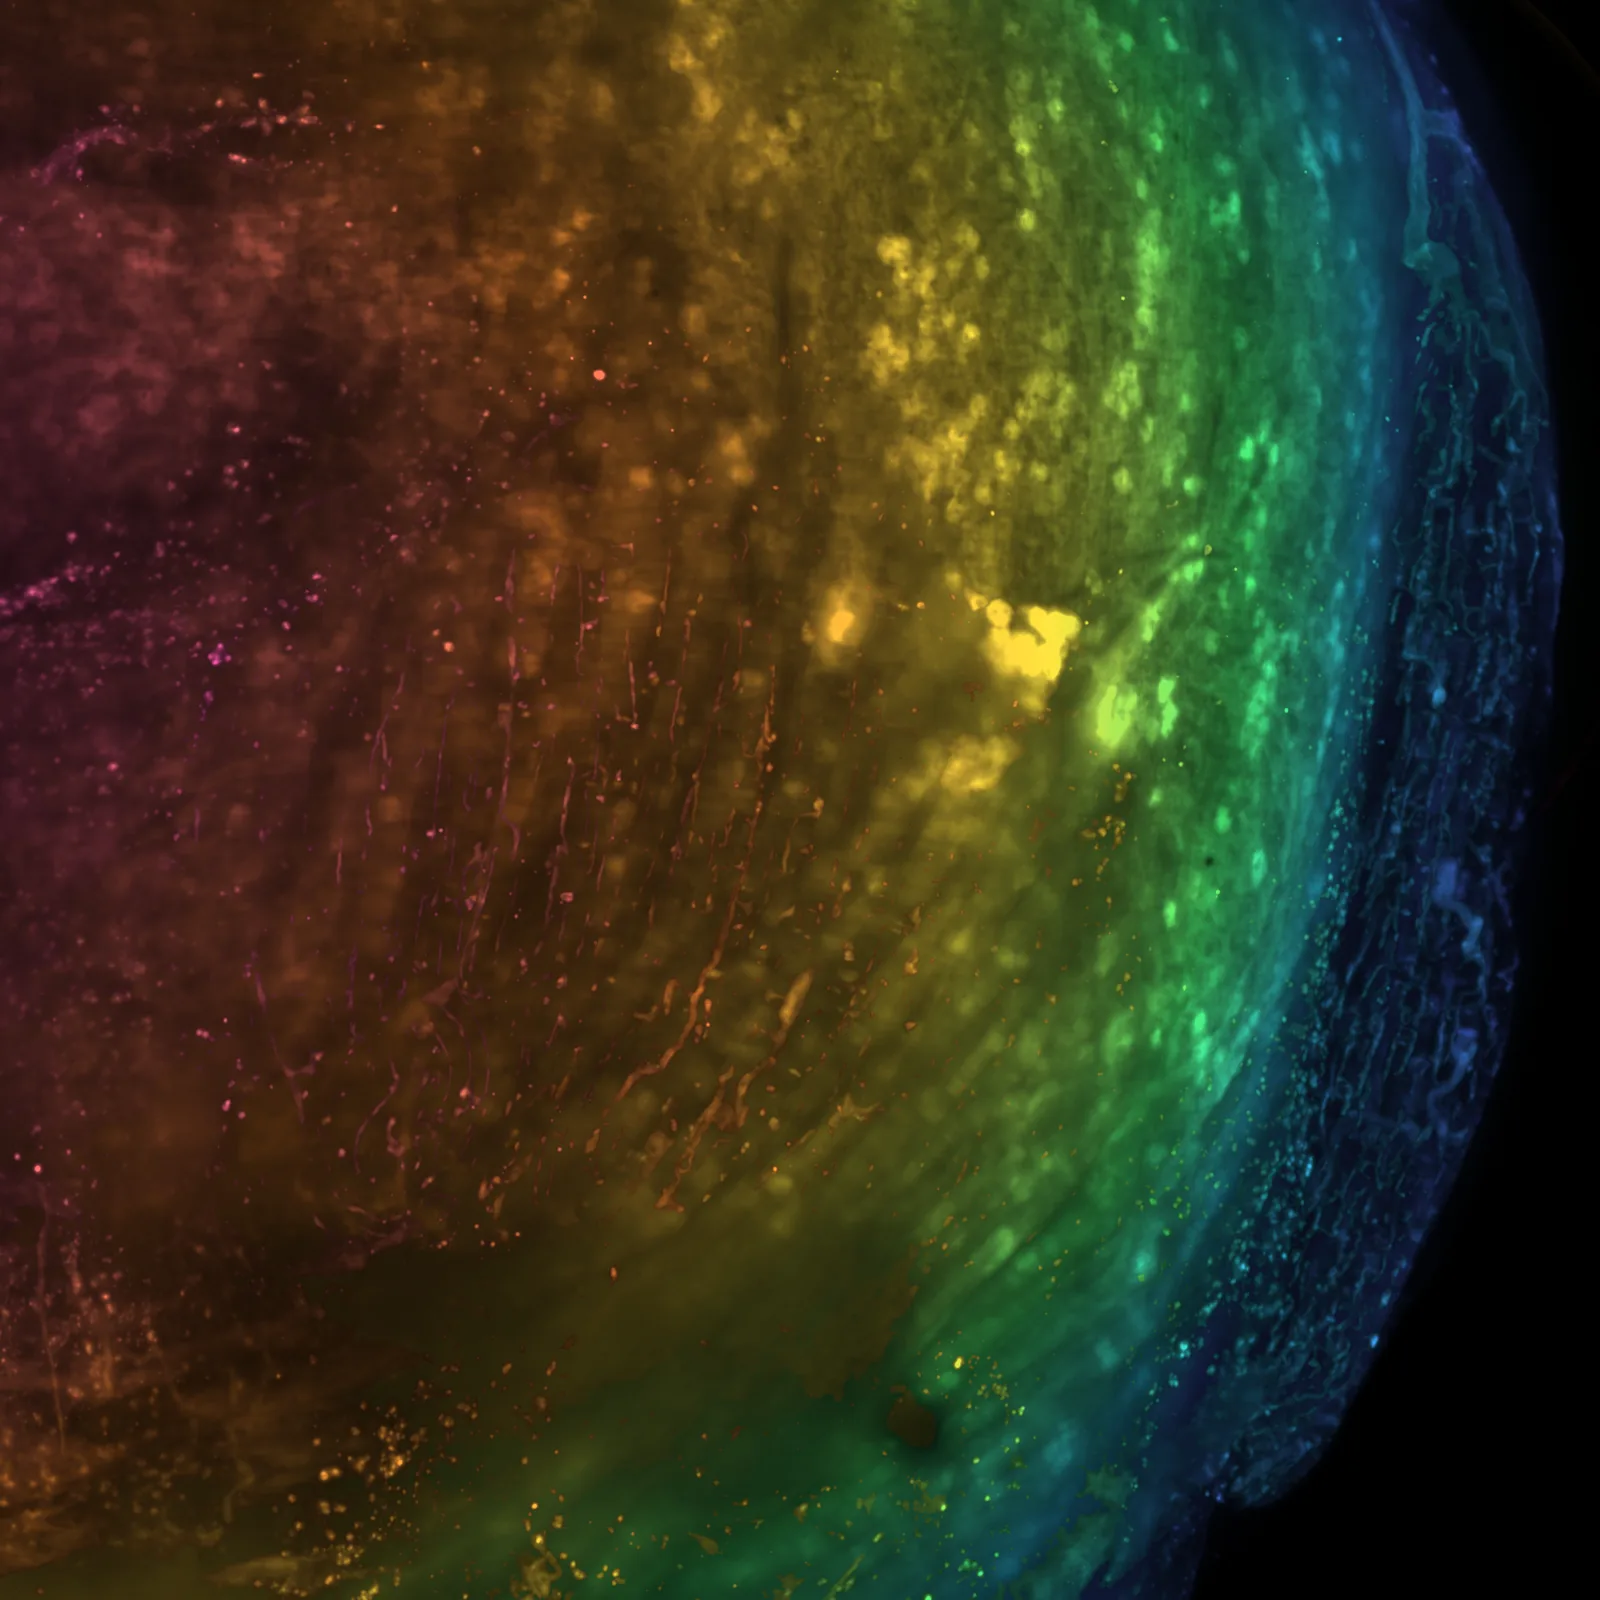
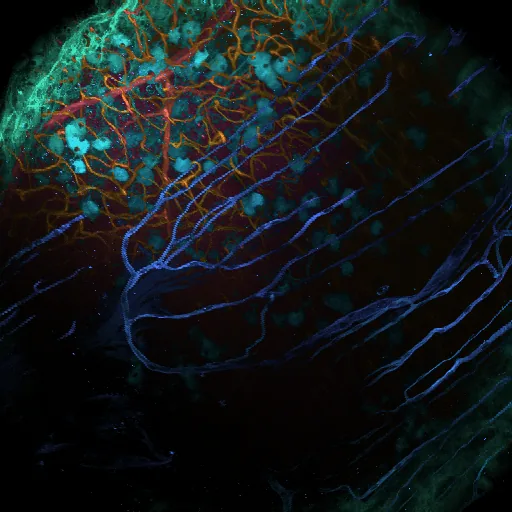
A cleared mouse eye in the light-sheet sample chamber, transparent enough to see through Rotating projection of the whole cleared eye Depth-coded projection of the whole cleared eye Higher-zoom light-sheet stack of a cleared eye, colour-coded by depth
Light-sheetTissue clearing

Whole cleared mouse eye, from organ to detail

An intact eye is pigmented and opaque; after clearing and refractive-index matching it becomes transparent (1), so the whole organ can be stained (Alexa Fluor 647) and imaged in one light-sheet acquisition (2), then re-imaged at higher zoom for local detail (3).

Instrument
Zeiss Lightsheet (Axio Observer SPIM), Gladstone Institutes imaging facility
Objective
5× / 0.16 detection; zoom 0.4 (whole eye) and 1.0 (detail)
Whole eye
1920 × 1920 × 416 voxels · 4.4 × 4.4 × 3.5 mm · 2.29 × 2.29 × 8.37 µm
Detail
1920 × 1920 × 190 voxels · 1.76 × 1.76 × 1.69 mm · 0.91 µm pixels
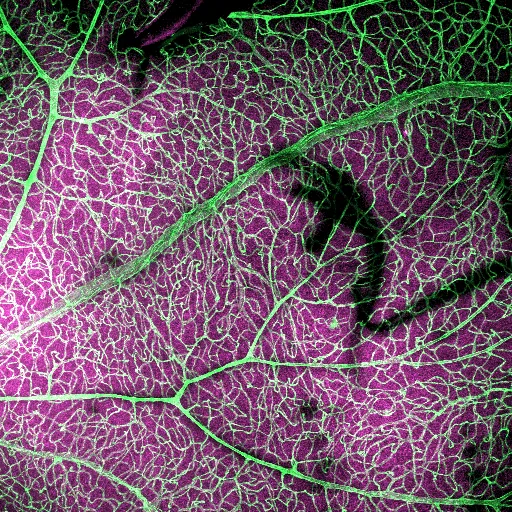
Two-photon projection of the limbus: Schlemm's canal, collector channels and episcleral veins Rotating projection of the outflow structures Real-time two-photon stream over the limbal vessels showing blood flow Label-free third-harmonic stream showing single red blood cells
In vivo multiphotonAqueous outflow

Schlemm's canal and the outflow pathway, live

The conventional outflow pathway imaged through the intact limbus: Schlemm's canal, the collector channels that leave it and the episcleral veins they drain into. Z-stacks give the structure; fast streams and line scans of the same vessels capture blood flow.

Instrument
Thorlabs multiphoton, ThorImageLS, resonant–galvo scanning, 920 nm
Objective
Nikon 16× water, 3 mm WD
Structure
1024 × 1024 × 261 voxels · 1.27 × 1.27 mm × 130 µm · 0.5 µm Z-step
Flow
512 × 512 px at 29.6 frames/s, 713 µm field; 5 s shown
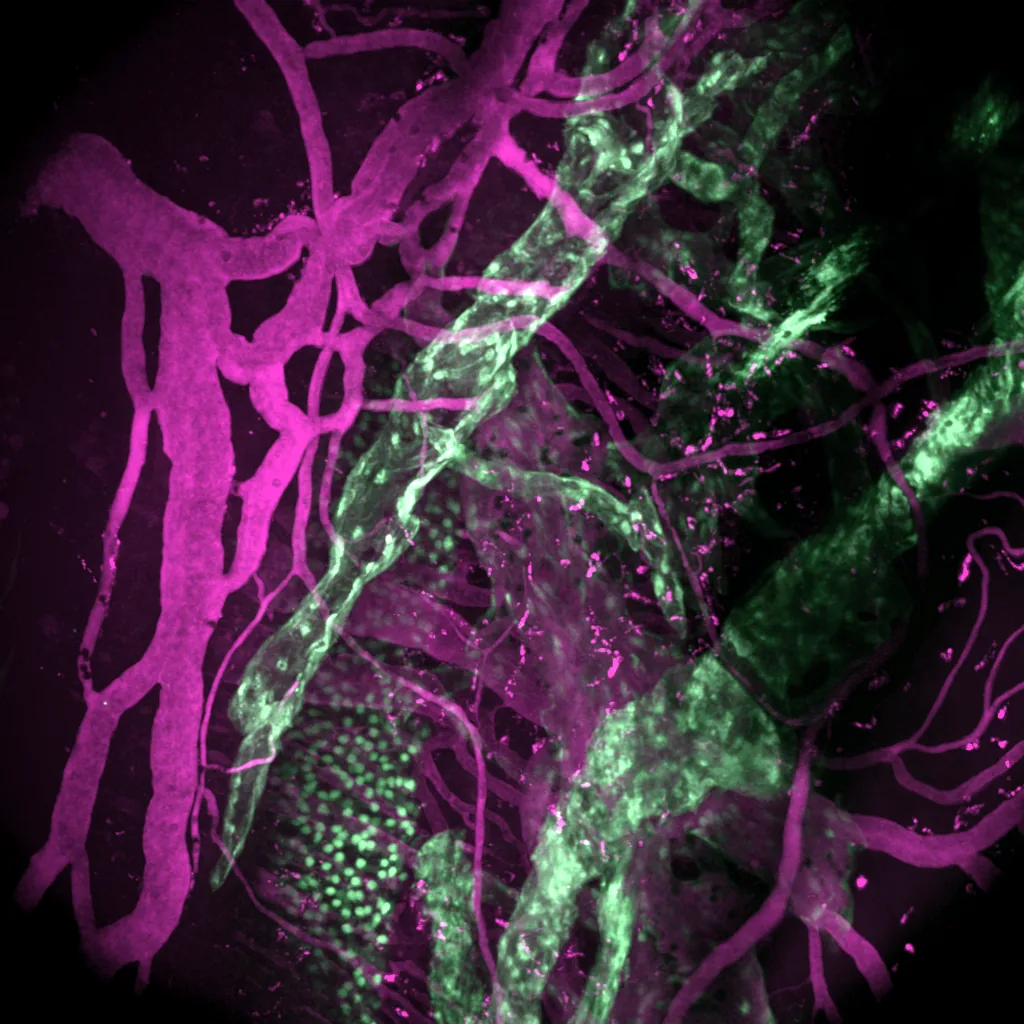
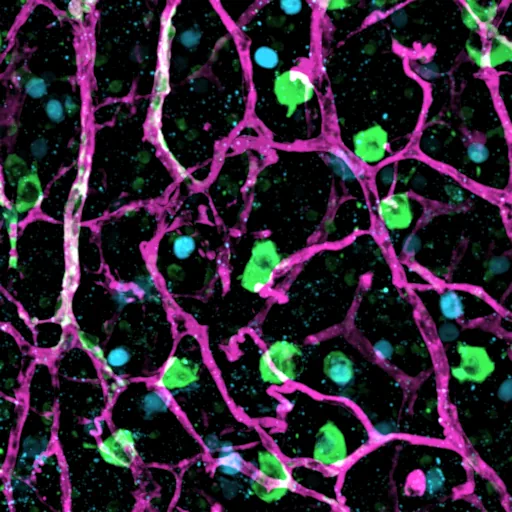
Projection of vessels (IB4) and retinal ganglion cells Rotating projection of retinal vessels and ganglion cells Side projection
Confocal3 channels

Vessels and retinal ganglion cells at P10

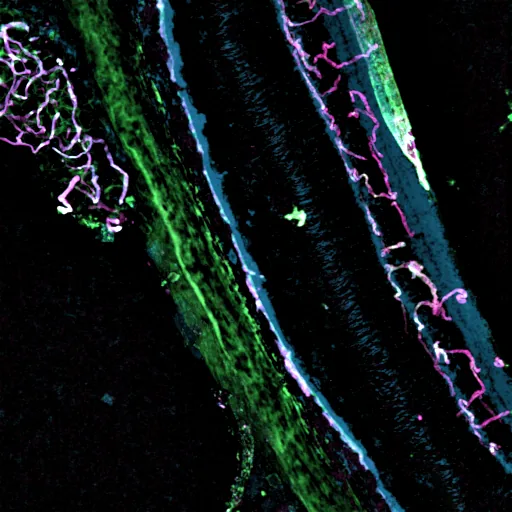
Developing retina with a neuronal GFP reporter, IB4-labelled vessels and Satb1-positive ganglion cells. High axial sampling (0.5 µm) resolves how neurons sit against the vessels of each plexus.

Channels
GFP (green) · IB4 (magenta) · Satb1 (cyan)
Volume
1024 × 1024 × 125 voxels · 228 × 228 × 62 µm
Voxel
0.22 × 0.22 × 0.5 µm
Retinal flatmount, mTmG and Piezo2 reporter with IB4 Side projection of the flatmount
ConfocalFlatmount

Retinal flatmount, reporter line with IB4

Z-stack of a retinal flatmount with a membrane reporter (mTmG), a Piezo2 reporter and IB4-labelled vessels.

Instrument
Zeiss LSM 900, ZEN
Objective
Plan-Apochromat 10× / 0.45
Channels
GFP (green) · tdTomato (magenta) · IB4 (cyan)
Volume
512 × 512 × 189 voxels · 1.28 × 1.28 × 0.19 mm
Confocal IHC of an eye cross-section Confocal IHC of an eye cross-section with retinal vessels and choroid
ConfocalIHC

Three-colour IHC of eye cross-sections

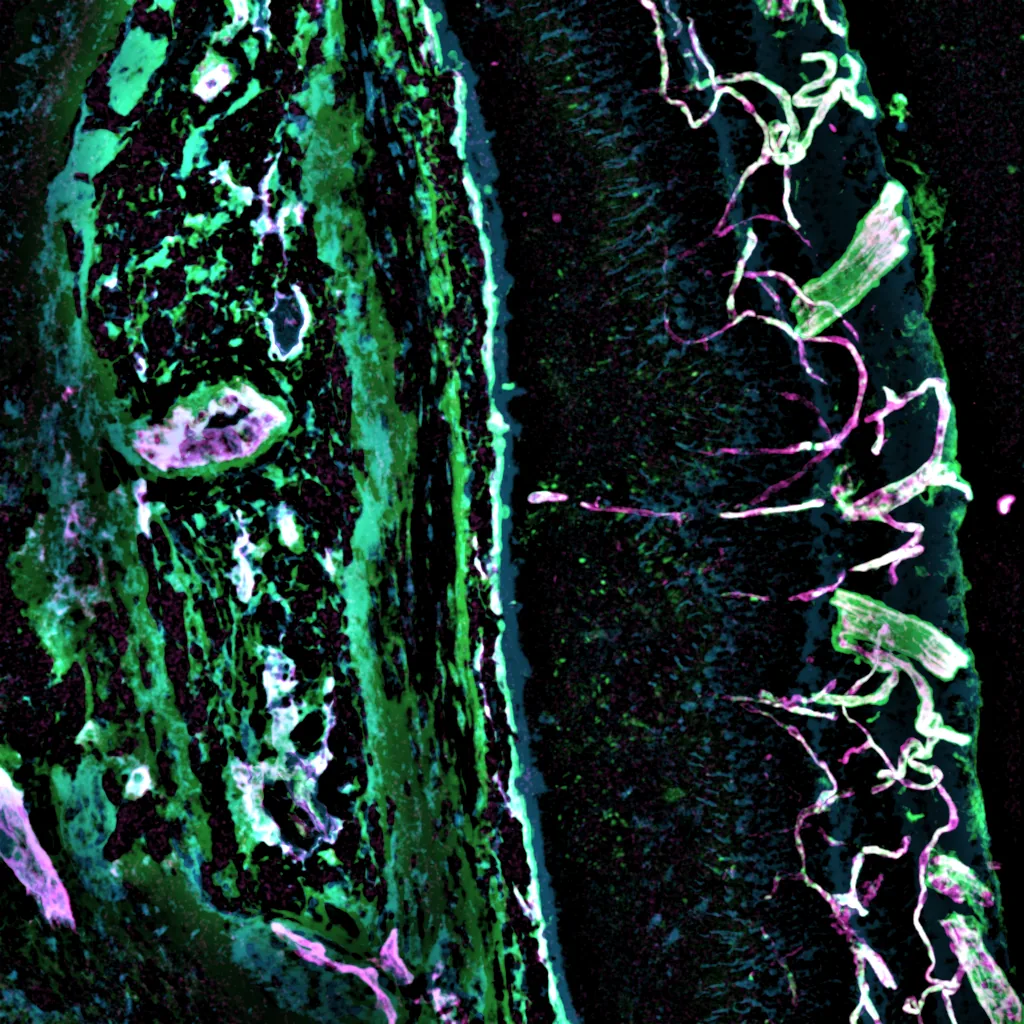
Immunostained cryosections through the retina and choroid, imaged as confocal Z-stacks, to tell vessel types apart: CD31 marks all endothelium, α-SMA the smooth-muscle coat of arteries and EphB4 the veins. Confocal IHC is how I validate structures found in the in vivo 3D data.

Instrument
Zeiss LSM 900, ZEN
Objective
Plan-Apochromat 20× / 0.8
Markers
CD31 (endothelium) · α-SMA (arteries) · EphB4 (veins)
Sections
Cryosections, 100 slides
Dyes
Alexa Fluor 647 (magenta) · 594 (green) · 488 (cyan)
Volume
512 × 512 × 211 voxels · 639 × 639 × 42 µm
Live-cell imagingPh.D.

Live single cells: find the target cell, then isolate it

During my Ph.D. I built and aligned a Raman optical tweezers platform for live single cells: cells are found by image-based recognition, held in the optical trap, measured by Raman spectroscopy and moved for isolation. This clip is from one of the projects: real-time deep-learning detection of nucleated red blood cells in a bright-field live-cell stream (about 30 frames/s), used to pick cells for single-cell Raman measurement.

Platform
Raman optical tweezers, built and aligned in the lab
Readout
Bright-field video, Raman spectra, transcriptome of the same cell
Source
Supplementary video, Fang et al., Analyst (2022), co-author

Also in my imaging experience

  • Live-cell imaging and optical manipulation: 2,000–3,000 single live cells imaged, identified and isolated with the optical tweezers.
  • High-NA confocal Raman microscopy of subcellular compartments (nucleus, cytoplasm, 0.4–1 µm vesicles) in drug-treated cancer cells.
  • Line scans for blood flow across the episcleral veins (two-photon), alongside the streams shown above.
  • Human retinal imaging data: OCT/OCTA and adaptive-optics SLO, analysed in MicroMorph (see below).

Case studies

Imaging designed around a question

How I take a biological question to an imaging assay and a quantitative readout.

Which retinal vascular layer is most vulnerable?

Segmented superficial, intermediate and deep plexus
Question2D flatmounts flatten three stacked vascular plexuses into one image, so layer-specific damage is missed.
AssayIn vivo trans-scleral two-photon volumes of the intact eye, in developmental and vascular-disease mouse models.
Analysis3D segmentation, centre-line tracing and layer assignment; new 3D network metrics (fragmentation index, fractal dimension, lacunarity, inter-plexus connectivity).
ResultA 3D analytical framework that reveals layer-associated vulnerability in development and neovascular remodelling (first author, bioRxiv 2026, under revision); now the lab's standard tool.

How do neurons shape a 3D vascular lattice?

Vessels and retinal ganglion cells
QuestionWhether perivascular neurons instruct how the retina's 3D vascular lattice forms.
AssayMulti-channel confocal and multiphoton volumes of developing retinas, with neuronal reporters and vascular labels.
My roleAcquired the images and did the processing, 3D visualisation and quantitative analysis.
ResultToma et al., Cell (2024): perivascular neurons instruct 3D vascular lattice formation via neurovascular contact.

Instruments & training

Running instruments for other people

I run my lab's multiphoton microscopes as a shared resource, the only such system in the lab, and I am the person new users learn them from.

SystemWhat I do on it
Two- and three-photon microscopes (lab, ThorImageLS)Operate as a shared resource; schedule all users; train new members, interns and external users; troubleshoot and realign; image samples for collaborating labs
Laser scanning confocal (Zeiss LSM 900/700, ZEN)IHC sections, flatmounts, tile scans and Z-stacks; onboard new lab members
Light-sheet (Zeiss Lightsheet, Gladstone Institutes)Trained user; whole cleared eyes
Raman optical tweezers and confocal Raman (Ph.D.)Built, aligned and maintained the platform; built a portable Raman system
Imaging data infrastructureSet up and maintain the lab's Synology NAS for imaging data

What I train people in

3Two-photon imaging. Lab members trained to run the multiphoton system on their own projects.
12Vessel segmentation and quantification. How to segment and trace vessels in Imaris and run my 3D analysis pipeline, from a raw volume to layer-resolved metrics.
✓Mouse perfusion. Hands-on training for lab members.

Reference: my PI, Dr. Tyson N. Kim, UCSF Department of Ophthalmology (contact details on request).

Instrument care

  • Troubleshoot the two-photon system with the vendor (case below).
  • Diagnosed scan-signal synchronisation and galvanometer scanner faults.
  • Built, aligned and maintained a Raman optical tweezers platform from components (Ph.D.).
  • Custom parts by 3D printing and soldering.

Teaching and service

  • Trained 4 outside labs, remotely, on the 3D analysis pipeline.
  • Mentored 5 student researchers; wrote lab SOPs.
  • Presented at ARVO; briefed the NEI Director.

Troubleshooting case: the two-photon microscope stopped producing images

SymptomNo usable image: instead of the sample, the screen showed a continuous, regular crossing pattern, like a double helix.
Ruled outChecked the basics in order: acquisition parameters and scan mode, objective and laser. Then a full restart of hardware and software to confirm that the computer, scan controller and detectors were communicating.
IsolatedWith the optics and laser working and the system communicating, the fault was narrowed down to signal transmission or processing between the detector and the acquisition electronics.
VendorWorked through it with Thorlabs remote support.
FixThe cable carrying the signal from the PMT to the signal-processing board had to be moved to a different input port. Imaging was restored.

Image analysis

From raw volume to numbers

Quantitative workflows in Fiji/ImageJ, Imaris and Cellpose, and the tools I build when existing ones stop short. The same two-photon volume, three stages:

Raw two-photon volume, side projection
1 · Raw volumeIn vivo two-photon, side projection coloured by depth.
Segmented vessels coloured by depth
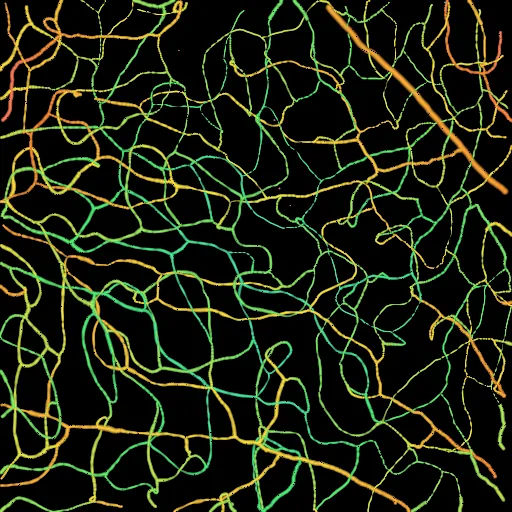
2 · SegmentationVessels segmented in 3D, coloured by depth.
Vessels assigned to the three plexuses
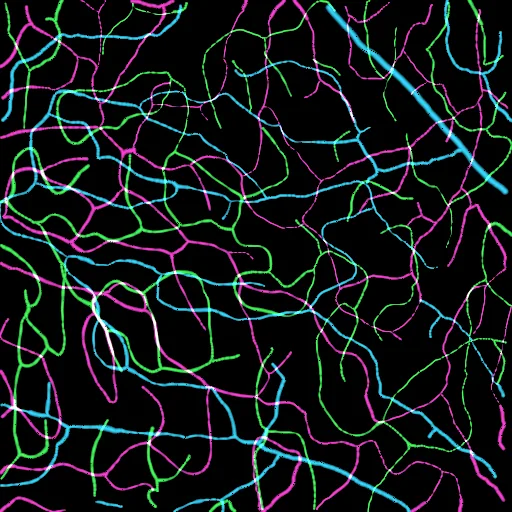
3 · Layers and metricsCentre lines assigned to the superficial, intermediate and deep plexus; density, diameter, branching and fractal metrics per layer.
Fiji/ImageJ macrosImaris filament tracingCellposeStarDist nnU-Net (trained)vesselFMnapariPython · NumPy · SciPy · PyTorchR · MATLAB

Software I built

MicroMorph: 3D microscopy analysis, from file to figure

A desktop application (Windows and macOS) that I designed and wrote to do what I kept doing by hand across Fiji, Imaris and scripts: open any microscope file, segment vessels and cells with AI, measure them in 3D, and report the result. An AI assistant can run the whole workflow from a plain-language request. A methods paper is in preparation.

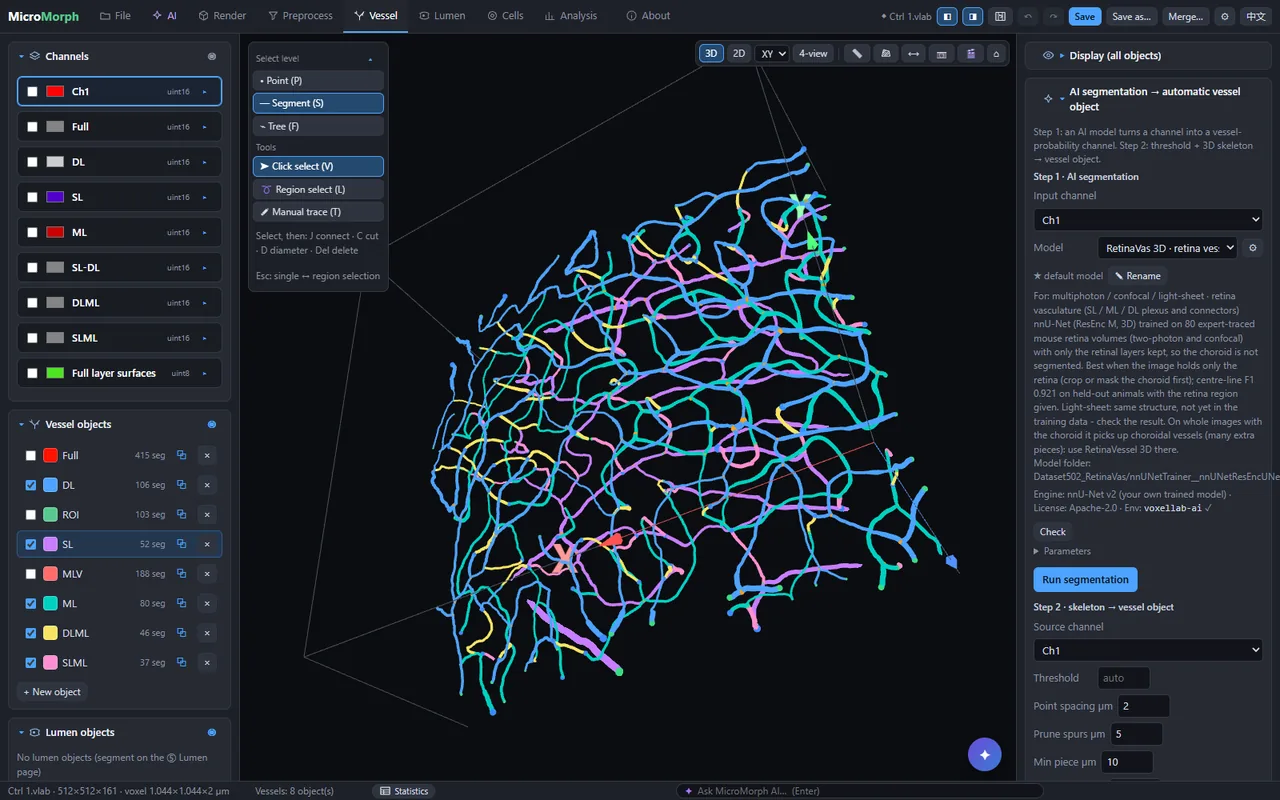
The real interface, recorded on one of my two-photon volumes: projects → 3D view by retinal layer → AI segmentation → 69 metrics → AI assistant.

Projects and data

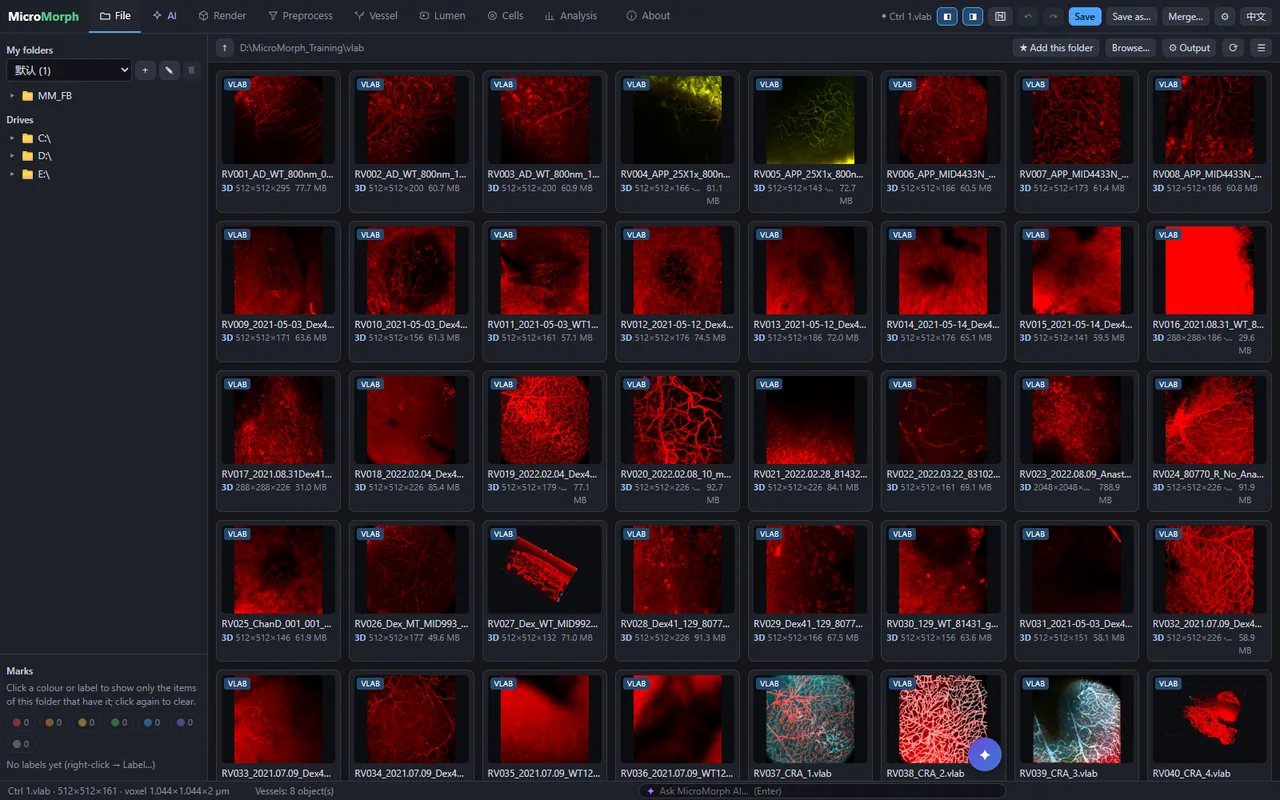
File browser with thumbnails and folder sets; every dataset becomes a .vlab project that keeps channels, objects, analyses, undo history and a processing log. Batch and group analysis across projects.

Reads the microscopes I use

Zeiss CZI/LSM, Imaris IMS, Leica LIF, Nikon ND2, Olympus OIB/OIF, OME-TIFF, Thorlabs image folders, DICOM OCT/OCTA, adaptive-optics raw files, NIfTI, NRRD, MRC, plus Bio-Formats through Fiji.

Segmentation

AI models (my own nnU-Net, vesselFM fine-tuned on my data, Cellpose, StarDist) and classical filters; 3D skeletons become editable vessel objects. Manual tracing with AutoPath, automatic gap bridging, cell objects.

Quantification

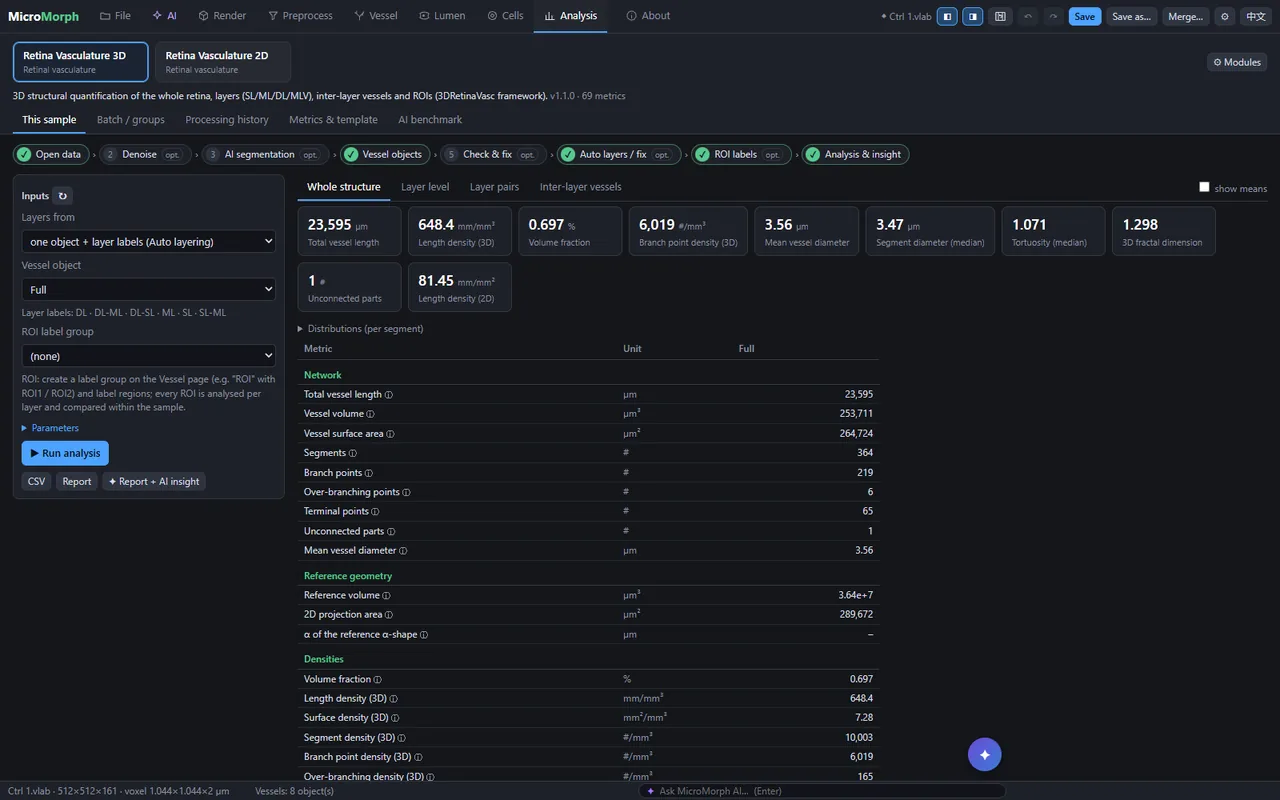
69 metrics for the retinal vasculature: length and branch density, diameter, tortuosity, fractal dimension, connectivity, per layer and per region; cell–vessel distances and contacts; statistics and reports with methods text.

AI assistant

Describe the analysis and the assistant calls MicroMorph's own tools: open, segment, layer, measure, compare groups, write the report. Works with Claude, OpenAI, DeepSeek, Qwen or Kimi; keys stay on the user's computer.

Sharing

Exports figures, movies, CSV, GraphML vessel graphs, OME-TIFF and nnU-Net training sets; prepares Zenodo dataset drafts and a benchmark package for others to test their methods.

MicroMorph file browser with project thumbnails
Projects: the 80 training volumes
AI segmentation panel with the model card of my nnU-Net model
AI segmentation and model card
Analysis page with whole-structure metrics
Analysis: 69 metrics in one click
Rotating 3D view of vessels coloured by retinal layer
3D view, vessels by layer

My retinal-vessel segmentation model, tested

I trained an nnU-Net (3D, residual encoder) on 80 expert-traced two-photon and confocal retina volumes from 46 animals, split by animal. Test set: 15 volumes the model never saw (14 held-out validation volumes and one animal from outside the training data), scored against expert tracing.

MethodCentre-line F1Branch-point F1clDiceFragments (median)
Classical filter (Sato + Otsu hysteresis)0.330.140.2978
vesselFM, public weights (zero-shot)0.650.380.4980
vesselFM fine-tuned on my data0.900.770.8515
My nnU-Net (default in MicroMorph)0.900.770.8610

Centre-line F1: traced centre lines matched within 3 µm; branch points within 6 µm. Fragments: pieces the vessel network breaks into (fewer is better; manual repair time scales with it). About 50 s per volume on one RTX 4080 GPU. With automatic gap bridging, fragments in the traced vessels fall by about half at the same F1.

One tool across imaging modalities

Two-photon retina, vessels by layer
Two-photon, in vivoSegmentation, tracing, automatic retinal layers.
Confocal retina with vessels and neurons
ConfocalVessels and cells in the same volume; cell–vessel contacts.
Light-sheet whole eye
Light-sheetMulti-gigabyte CZI volumes of whole cleared organs.
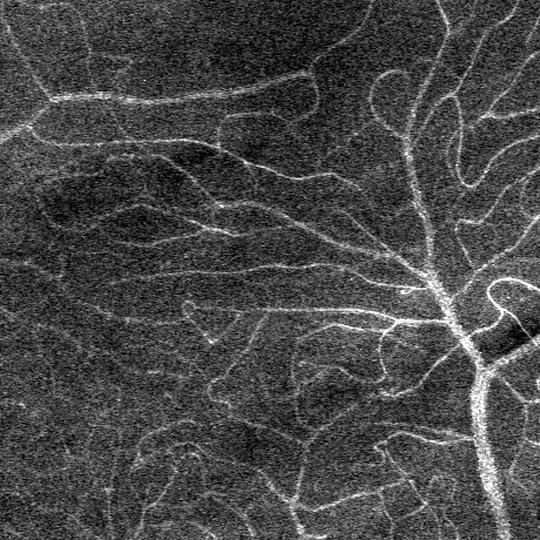
Two-photon stream of blood flow
Time seriesStreams and line scans: kymographs and flow maps.
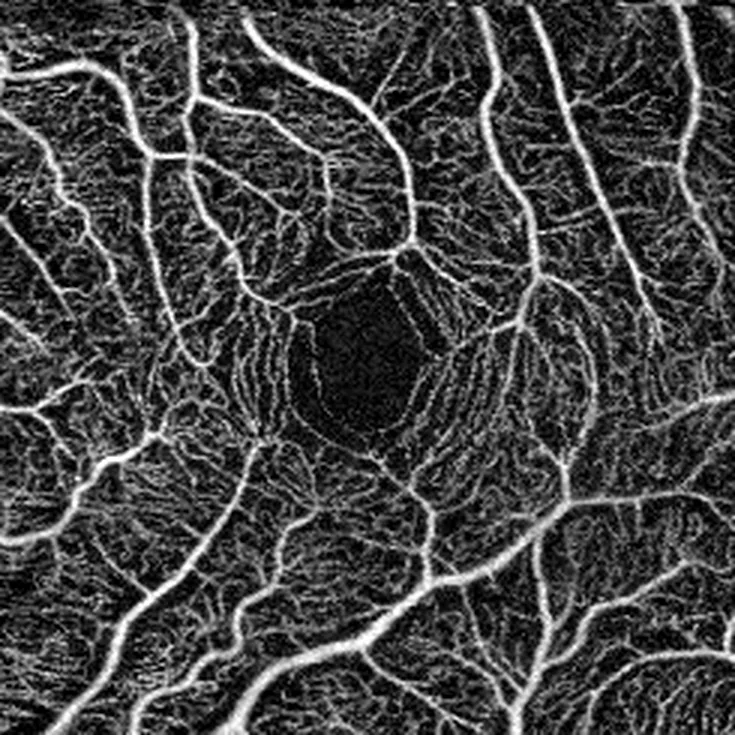
Human OCTA superficial plexus en face
Human OCTARetina layers, projection-artefact suppression, two scans registered and averaged, plexus maps.
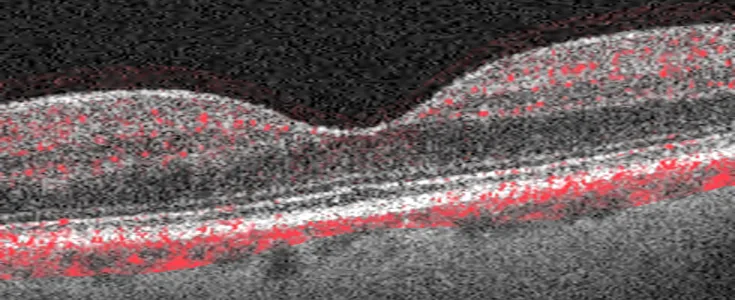
OCT B-scan through the fovea with flow overlay
OCT B-scan + flowStructure in grey, flow in red (depth stretched).
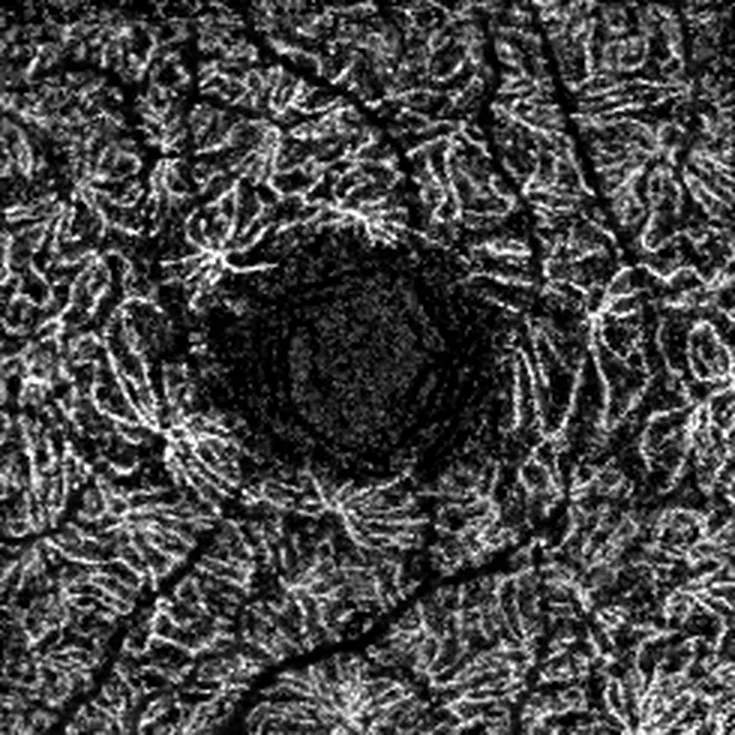
Human OCTA deep plexus en face
OCTA, deep plexusSame eye, deep capillary plexus, 3 × 3 mm.
Adaptive-optics SLO perfusion image, small region
Adaptive-optics SLOHeaderless raw files read directly; perfusion maps, montage matching (small region shown).

Human images are de-identified: they were rendered from pixel data only, with no file header, name, date or ID.

Try it

Request the MicroMorph demo

Leave your e-mail and I will send you a download link for the current demo build (Windows; macOS on request), free for academic use.

Your address is only used to send the link and to tell you about updates you ask for.

Publications

Selected publications

  1. Toma K, Zhao M, Zhang S, …, Shang W, et al. Perivascular neurons instruct 3D vascular lattice formation via neurovascular contact. Cell (2024). Imaging, 3D visualisation and analysis
  2. Shang W, Hong G, Keller WE, Morton RA, Zeboulon P, Toma K, Duan X, Gould DB, Kim TN. A three-dimensional analytical framework for retinal microvasculature reveals layer-associated vulnerability in development and neovascular remodeling. bioRxiv (2026); under revision. doi:10.64898/2026.03.16.711909
  3. Shang W, et al. A layer-resolved graph representation of three-dimensional retinal microvasculature from two-photon microscopy in mouse models of vascular disease (RetinalVasc3D). In preparation.
  4. Shang W, Ye A, Tong Y-K. Sub-cellular dynamic analysis of BGC823 cells after treatment with the multi-component drug CKI using Raman spectroscopy. Int J Mol Sci (2023).
  5. Fang T, Shang W, Liu C, Liu Y, Ye A. Single-cell multimodal analytical approach by integrating Raman optical tweezers and RNA sequencing. Analytical Chemistry (2020).
  6. Fang T, Shang W, Liu C, Xu J, Zhao D, Liu Y, Ye A. Nondestructive identification and accurate isolation of single cells through a chip with Raman optical tweezers. Analytical Chemistry (2019).
  7. Fang T, Yuan P, Gong C, Jiang Y, Yu Y, Shang W, Tian C, Ye A. Fast label-free recognition of NRBCs by deep-learning visual object detection and single-cell Raman spectroscopy. Analyst (2022). doi:10.1039/d2an00024e

All publications on Google Scholar